
The tide chart
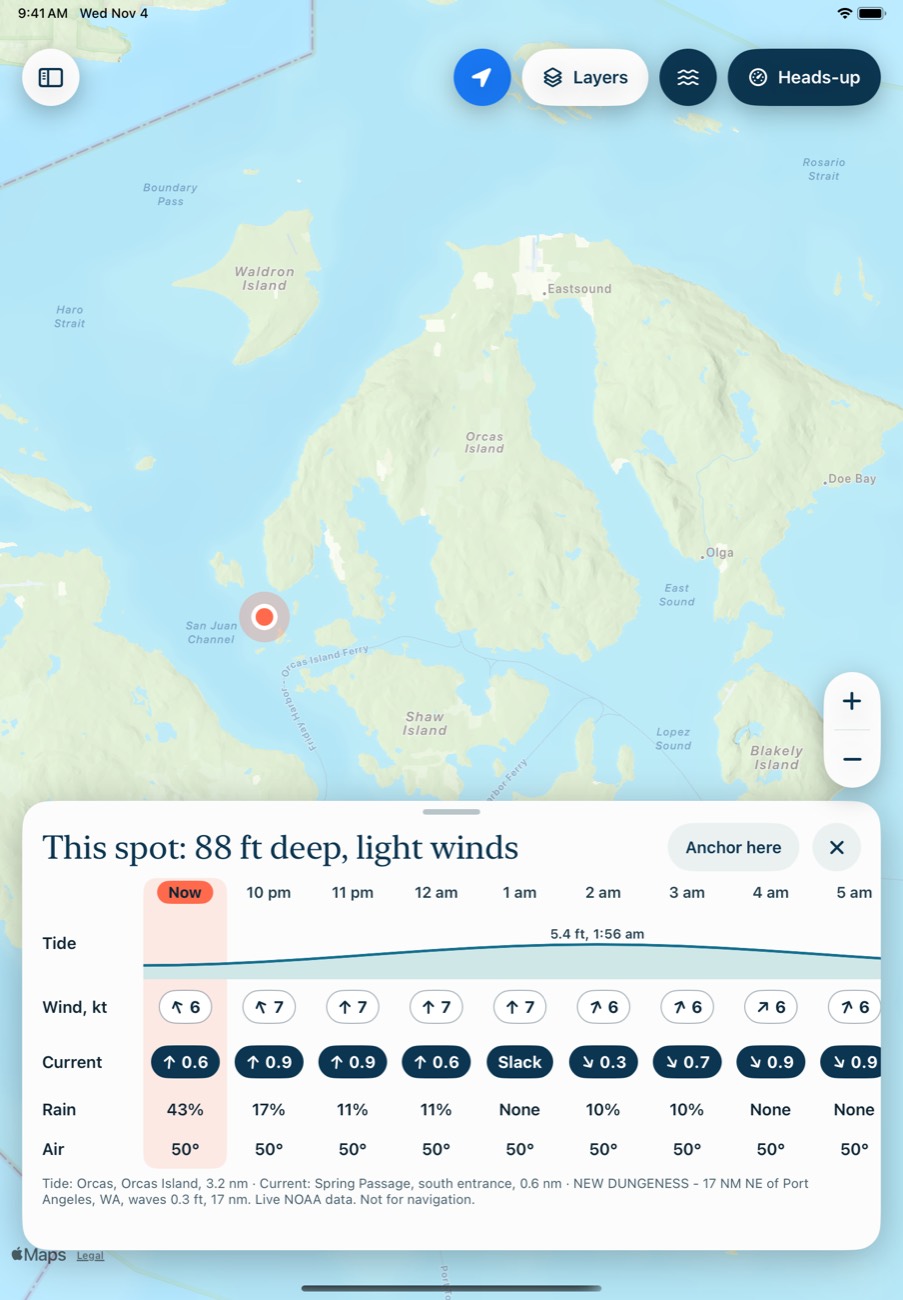
The chart along the bottom shows the tide at the spot you tapped, or otherwise at your position, or otherwise at the middle of the map. The wave button at the top right shows or hides it.
It might say "Tide 4.2 ft, rising", with the next high or low and the station it comes from. Tide heights are always in feet.
Which station it uses
It uses the nearest NOAA tide station within 15 nm, and the nearest current station within 10 nm. If there isn't one, it says "No tide station nearby" rather than guessing from somewhere far away. Currents can change a lot within a short distance, so read them as a guide.
When the water isn't following the table
The chart is always a prediction, and wind and pressure can push the real water away from it. So Breaking Wind also reads the nearest NOAA gauge within 20 nm. If the measured level is at least 0.3 ft off, the chart's note changes, for example:
Water 0.4 ft above prediction · High at 3:12 pm
This only shows for right now, with no spot open, when the gauge's reading is under 30 minutes old. The app refreshes predictions automatically and reads the gauge every few minutes.
Currents
Turn on the Current layer to see them on the map. Tap Current in the heads-up view for the flood or ebb, the chart and an hour-by-hour list. Under 0.2 knots counts as slack.
In anchor math
Anchor math uses the predicted highs and lows during your stay. If you're using the chart depth, it also adds the measured difference. If you enter a sounding, that already includes it.
Common problems
It says "No tide station nearby."
There's no NOAA tide station within 15 nm. That includes Canadian waters.
It says "Couldn't reach NOAA."
The app couldn't get the data. Check your connection. If it keeps happening, NOAA's service may be down.
Next: Heads-up and trips