
Add a layer
Tap Layers, then turn on what you want. Any combination works, except that Depth and Bathymetry replace each other. When you open the app again, it goes back to just Marks and Fleet.
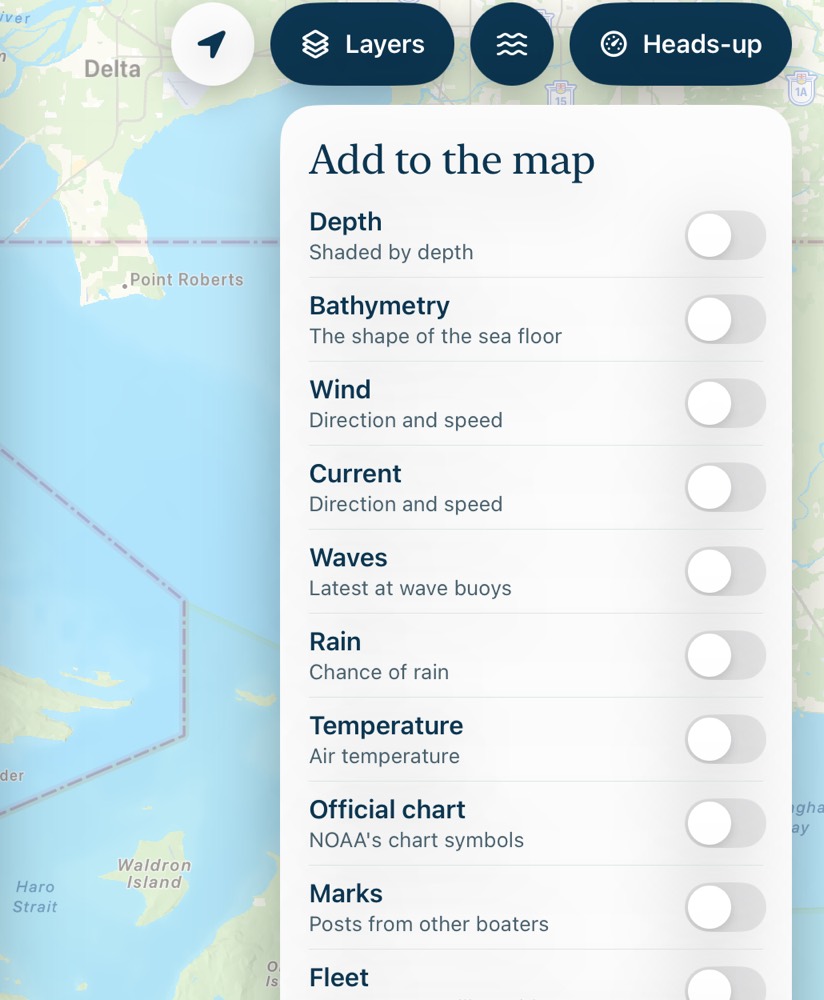
While a layer is on, a key explains what you're seeing. It shows which time you're looking at, and it hides while the Layers panel or a spot is open.
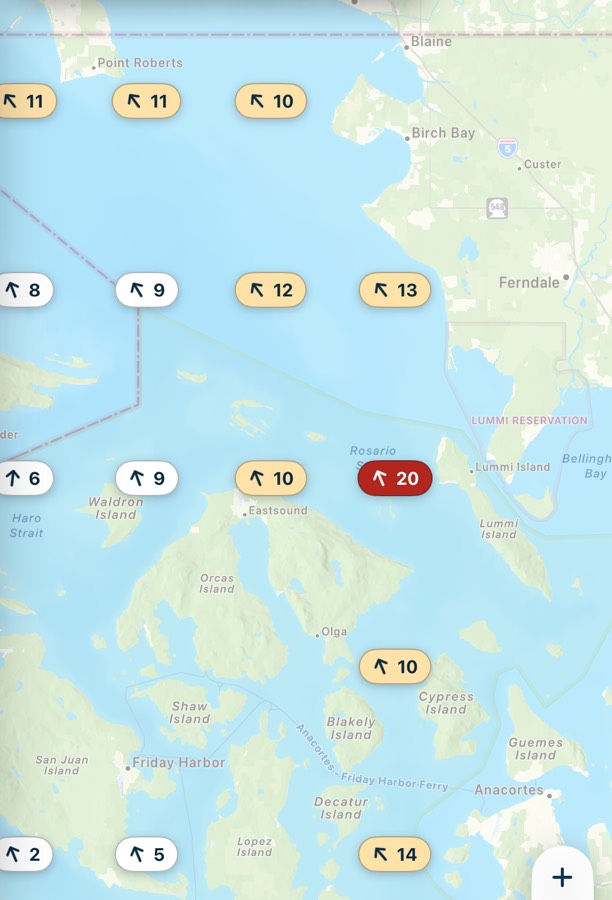
Wind
The arrow points where the wind is blowing, and the number is knots. The color shows the strength: white is under 10, pale amber is 10 to 14, orange is 15 to 19, and red is 20 and up.
Current
The arrow points where the water is going, with its speed. Under 0.2 knots it says Slack.

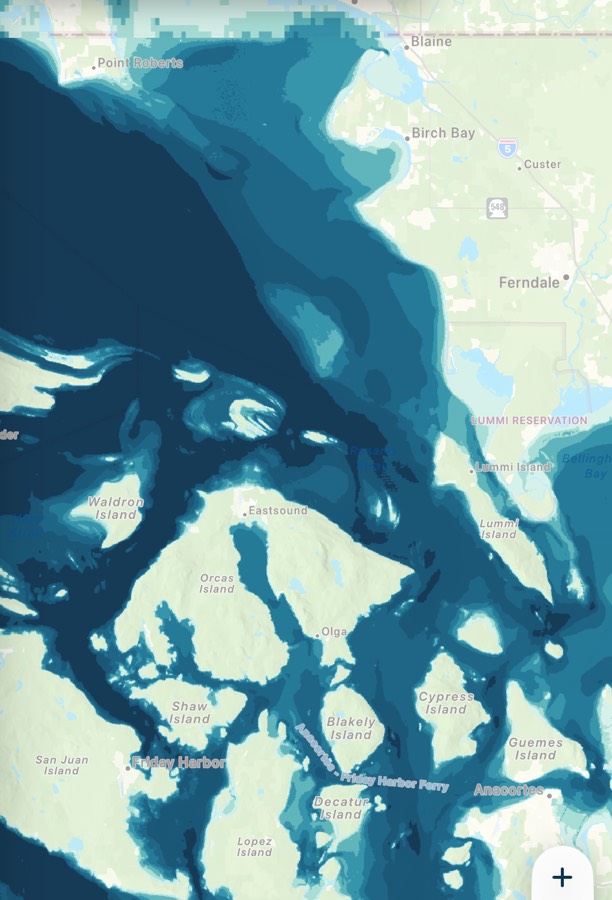
Depth
The water is tinted darker where it's deeper, and the key gives the depths in feet. It comes from NOAA's elevation model, so it isn't a chart.
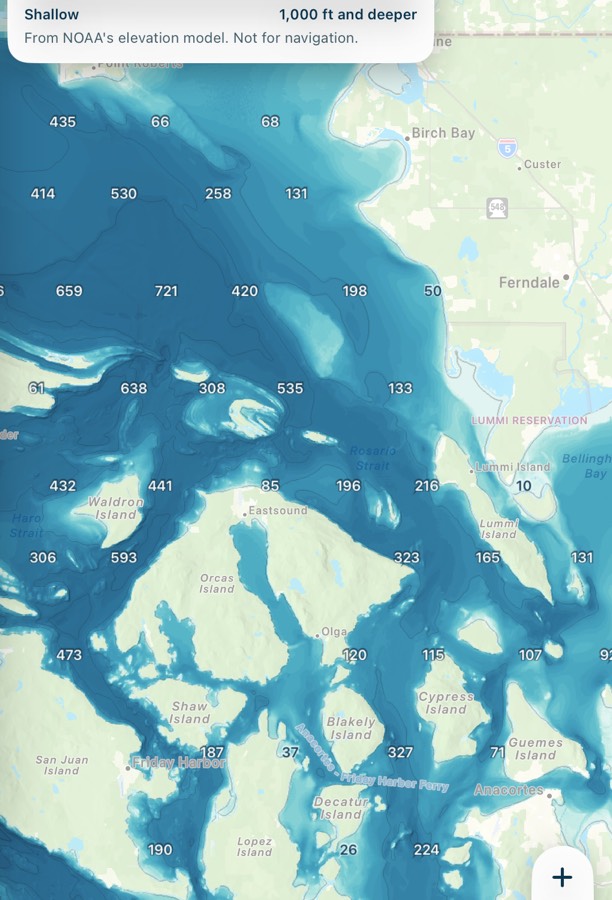
Bathymetry
The sea floor as if the water were gone, with contour lines and depth numbers. Zoom in for closer contours, from every 500 ft down to every 50 ft. These numbers are always in feet.
Waves
The latest height at the nearest wave buoys. There aren't many buoys, so you may need to zoom out to see one. This always shows the latest reading, even if you've picked a later time.
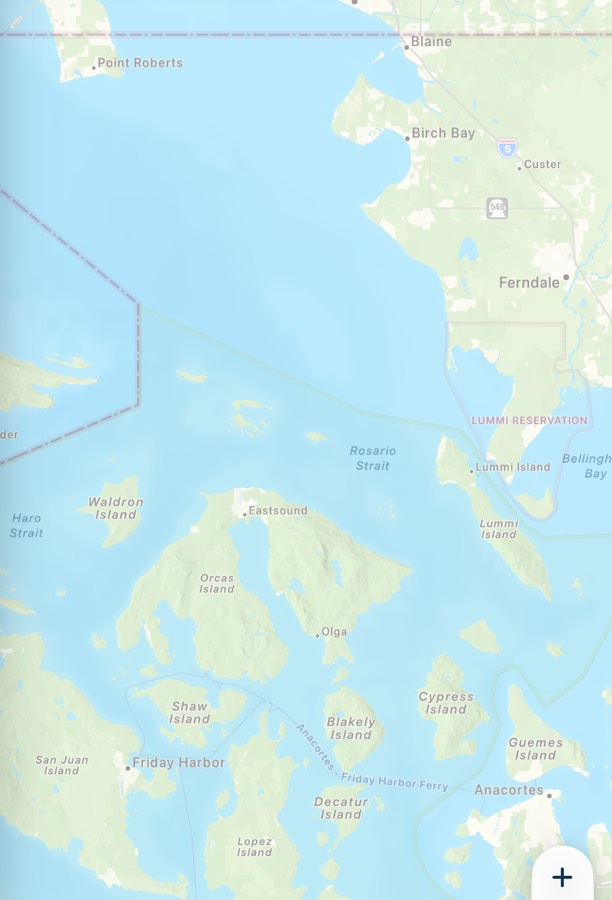
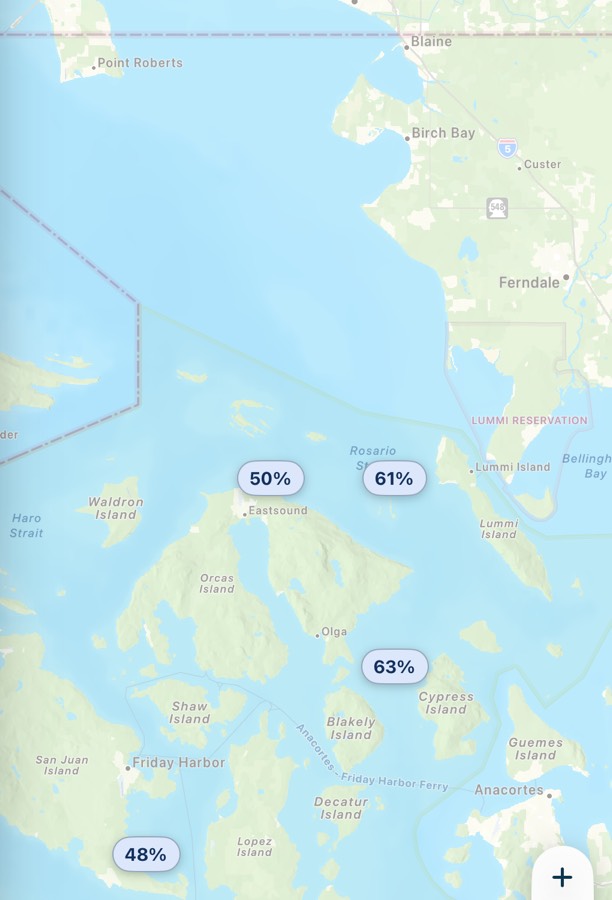
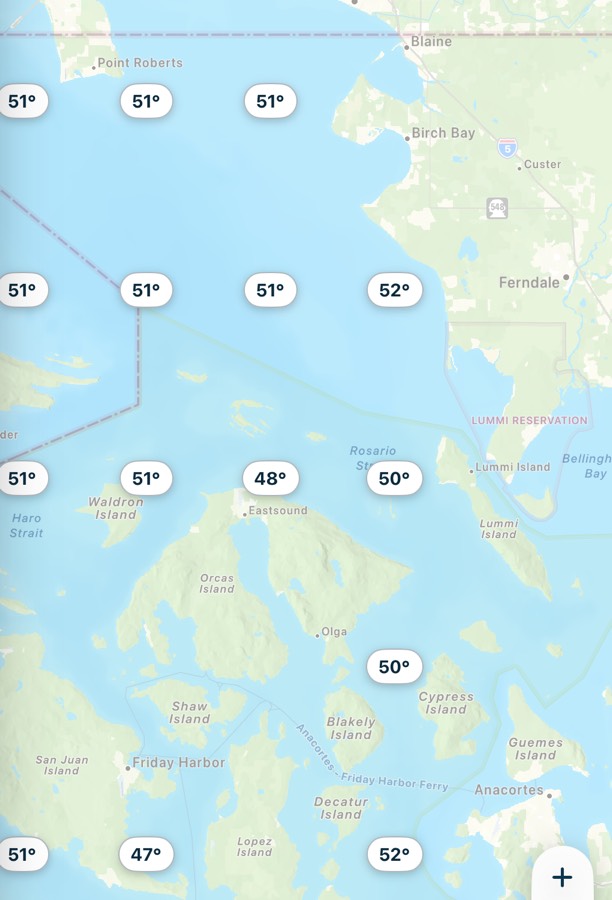
Rain and temperature
The chance of rain as a percentage, and the air temperature, for the hour you're looking at.
Official chart
NOAA's chart symbols, including buoys and soundings, drawn over the map. It's useful, but it's not a replacement for a current official chart.
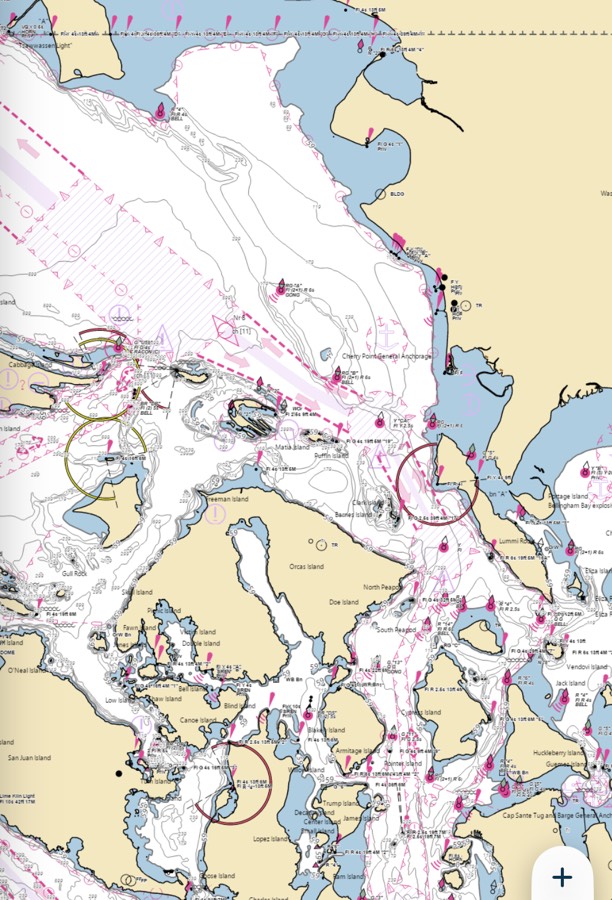
Charted rocks, wrecks and obstructions always show once you zoom in, whatever layers you have on.
Marks and fleet
These two start on. Marks shows photo pins for other boaters' posts. Fleet shows the boats you're sailing with. Turn them off for a plainer map. See Marks and posts and Sail with a fleet.
Common problems
A layer shows nothing.
Zoom out, because stations and buoys can be spread out, and check your connection. Tide, current and wave data depend on stations near you, and Canadian waters don't have NOAA tides or currents.
My layers went away.
Layers reset to Marks and Fleet each time the app opens.